How to monitor nginx with prometheus and grafana
1. Purpose
In this post, I will demonstrate how to monitor nginx with Prometheus and Grafana.
2. Environment
- Linux
3. The solution
3.1 Make sure that ‘http_stub_status_module’ is enabled in your nginx
We need the http_stub_status_module module to expose metrics of nginx to Prometheus. Verify as follows:
$ nginx -VIf you find the -http_stub_status_module in the response, then you are done.
Otherwise, you should enable it in your nginx. You can refer to this article for this job.
3.2 Expose the nginx status page
Now we should add a server block in nginx to expose the status page:
server { listen 8080; server_name localhost; location /nginx_status { stub_status; allow 127.0.0.1; # only allow requests from localhost deny all; # deny all other hosts }}Here we listen on port 8080, and you can visit /nginx_status to get the status of nginx:
$ curl http://localhost:8080/nginx_statusActive connections: 30server accepts handled requests 156781 156781 158849Reading: 0 Writing: 29 Waiting: 13.3 Download nginx prometheus exporter
Now we need to convert the nginx metrics to a format that Prometheus can read. We can achieve this using the nginx-prometheus-exporter:
$ wget https://github.com/nginxinc/nginx-prometheus-exporter/releases/download/v0.9.0/nginx-prometheus-exporter_0.9.0_linux_amd64.tar.gzExtract it and start it as follows:
$ ./nginx-prometheus-exporter -nginx.scrape-uri=http://localhost:8080/nginx_status
2021/04/07 11:02:31 Starting NGINX Prometheus Exporter version=0.9.0 commit=5f88afbd906baae02edfbab4f5715e06d88538a0 date=2021-03-22T20:16:09Z2021/04/07 11:02:31 Listening on :91132021/04/07 11:02:31 NGINX Prometheus Exporter has successfully started
If you want to start it in the background, you can run it with nohup:
$ nohup ./nginx-prometheus-exporter -nginx.scrape-uri=http://localhost:8080/nginx_status > nohup.out &3.4 Configure prometheus job
Now that we have the metrics page, we want Prometheus to scrape it regularly. Add these lines to prometheus.yml:
- job_name: 'nginx' static_configs: - targets: ['localhost:9113']Now restart Prometheus.
3.5 Configure grafana dashboard
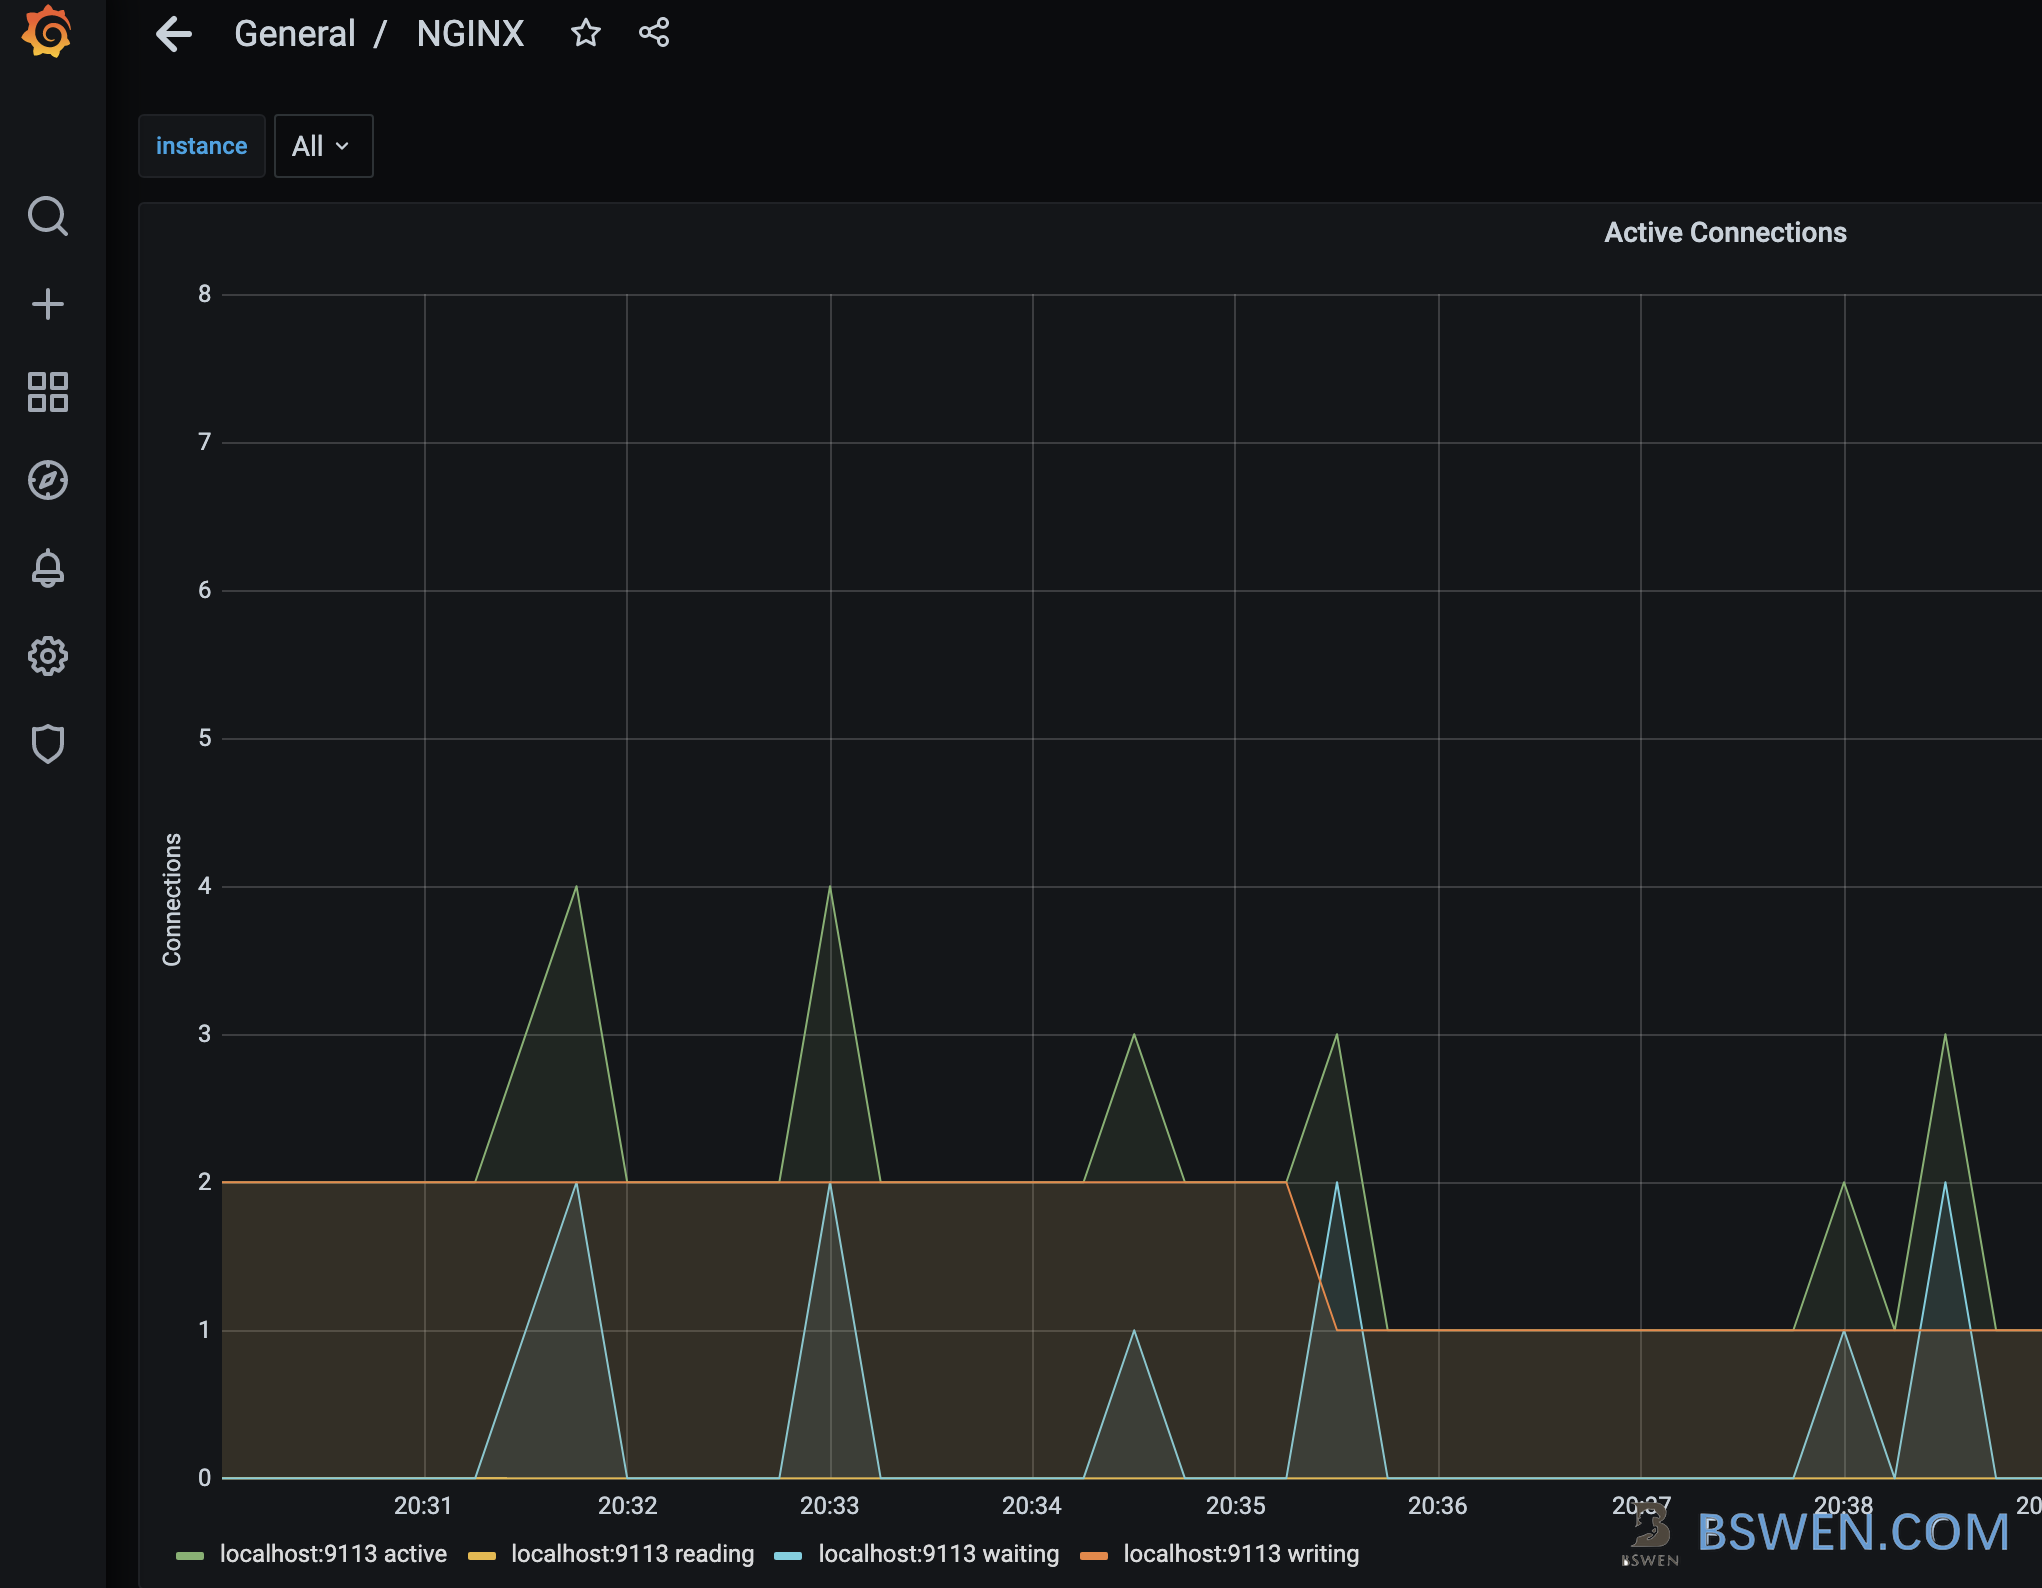
We can import an official nginx dashboard from Grafana, and then we can see the result:
It works!
4. Summary
In this post, I demonstrated how to monitor nginx with Prometheus and Grafana. The key steps include enabling the http_stub_status_module in nginx, exposing the status page, using the nginx-prometheus-exporter to convert metrics, and configuring Prometheus and Grafana to visualize the data. This setup provides a powerful way to monitor the performance and health of your nginx server.
Final Words + More Resources
My intention with this article was to help others share my knowledge and experience. If you want to contact me, you can contact by email: Email me
Here are also the most important links from this article along with some further resources that will help you in this scope:
- 👨💻 nginx http_stub_status_module
- 👨💻 Enable nginx status page
- 👨💻 nginx prometheus exporter
- 👨💻 Grafana nginx dashboard
Oh, and if you found these resources useful, don’t forget to support me by starring the repo on GitHub!
Comments